


Main Economic Indicators
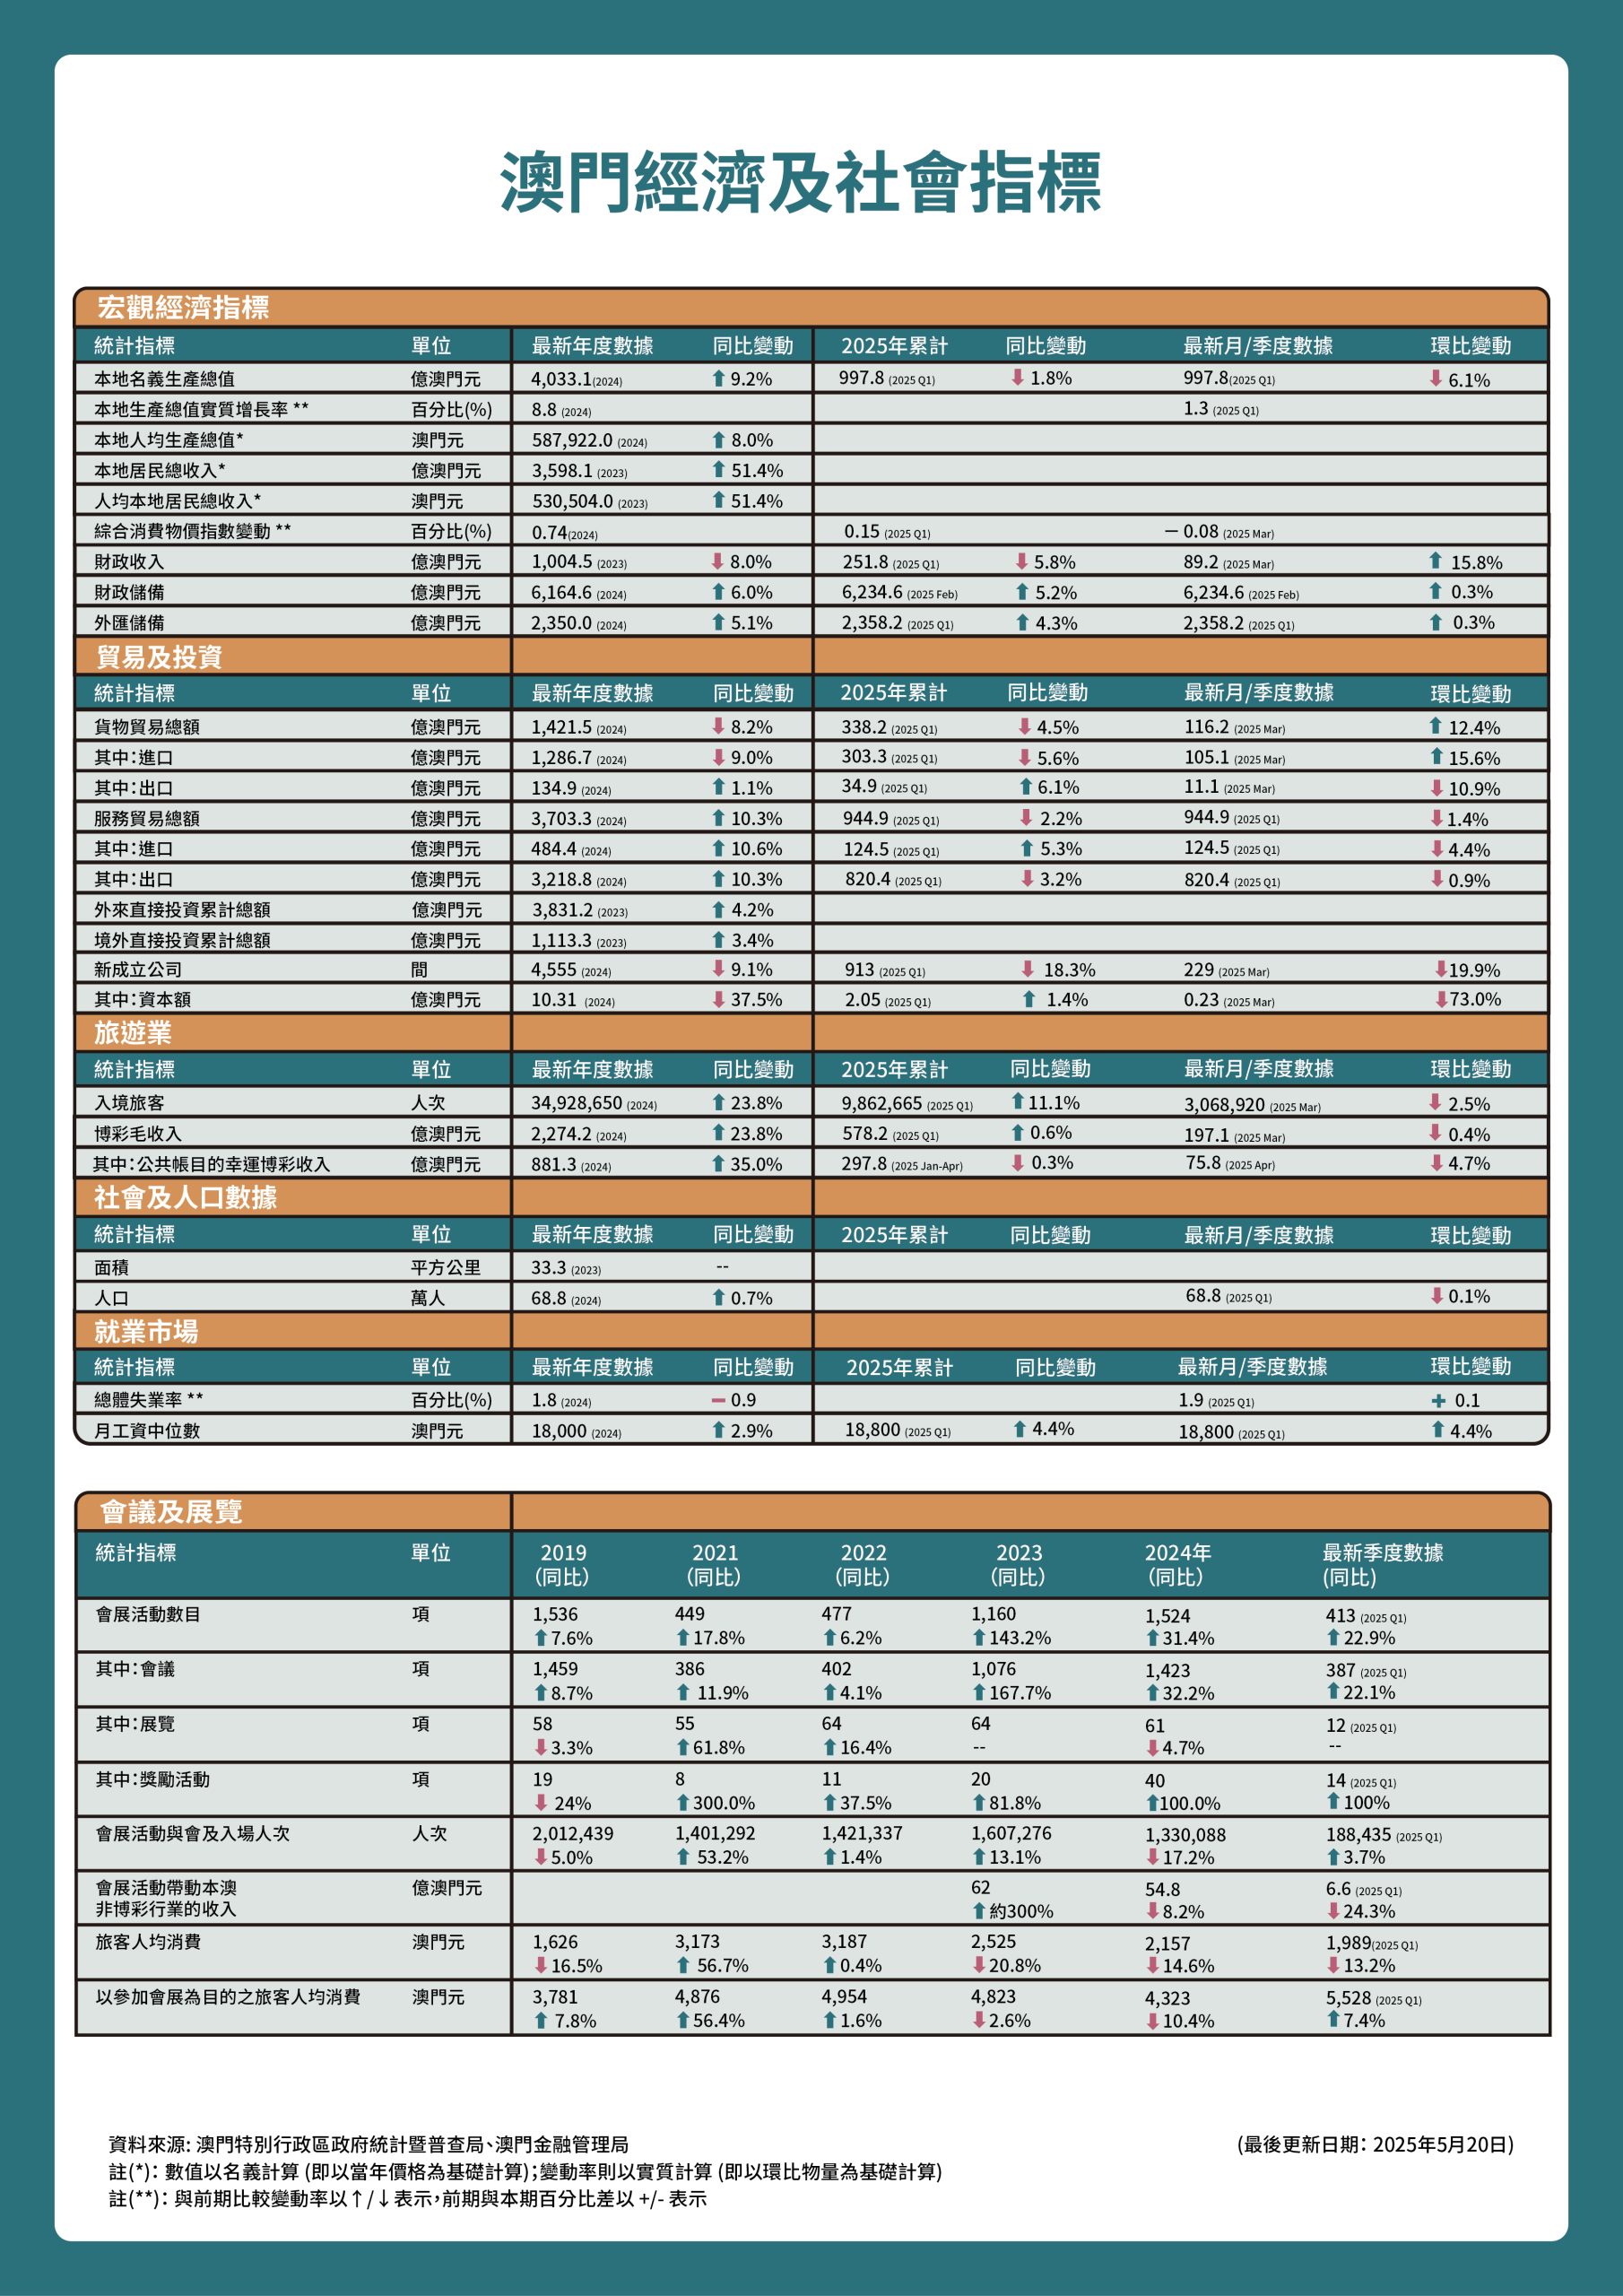
Macao’s Principle Economic Statistical Indicators
Updated on 7-May-2024
| Statistical Indicators | Unit | Latest Annual Data (Change) |
Latest Data (Monthly / Quarterly) | % Change (Monthly / Quarterly) |
||
| Macroeconomy | ||||||
| 2023 | 2023 Q3 | 2023 Q4 | ||||
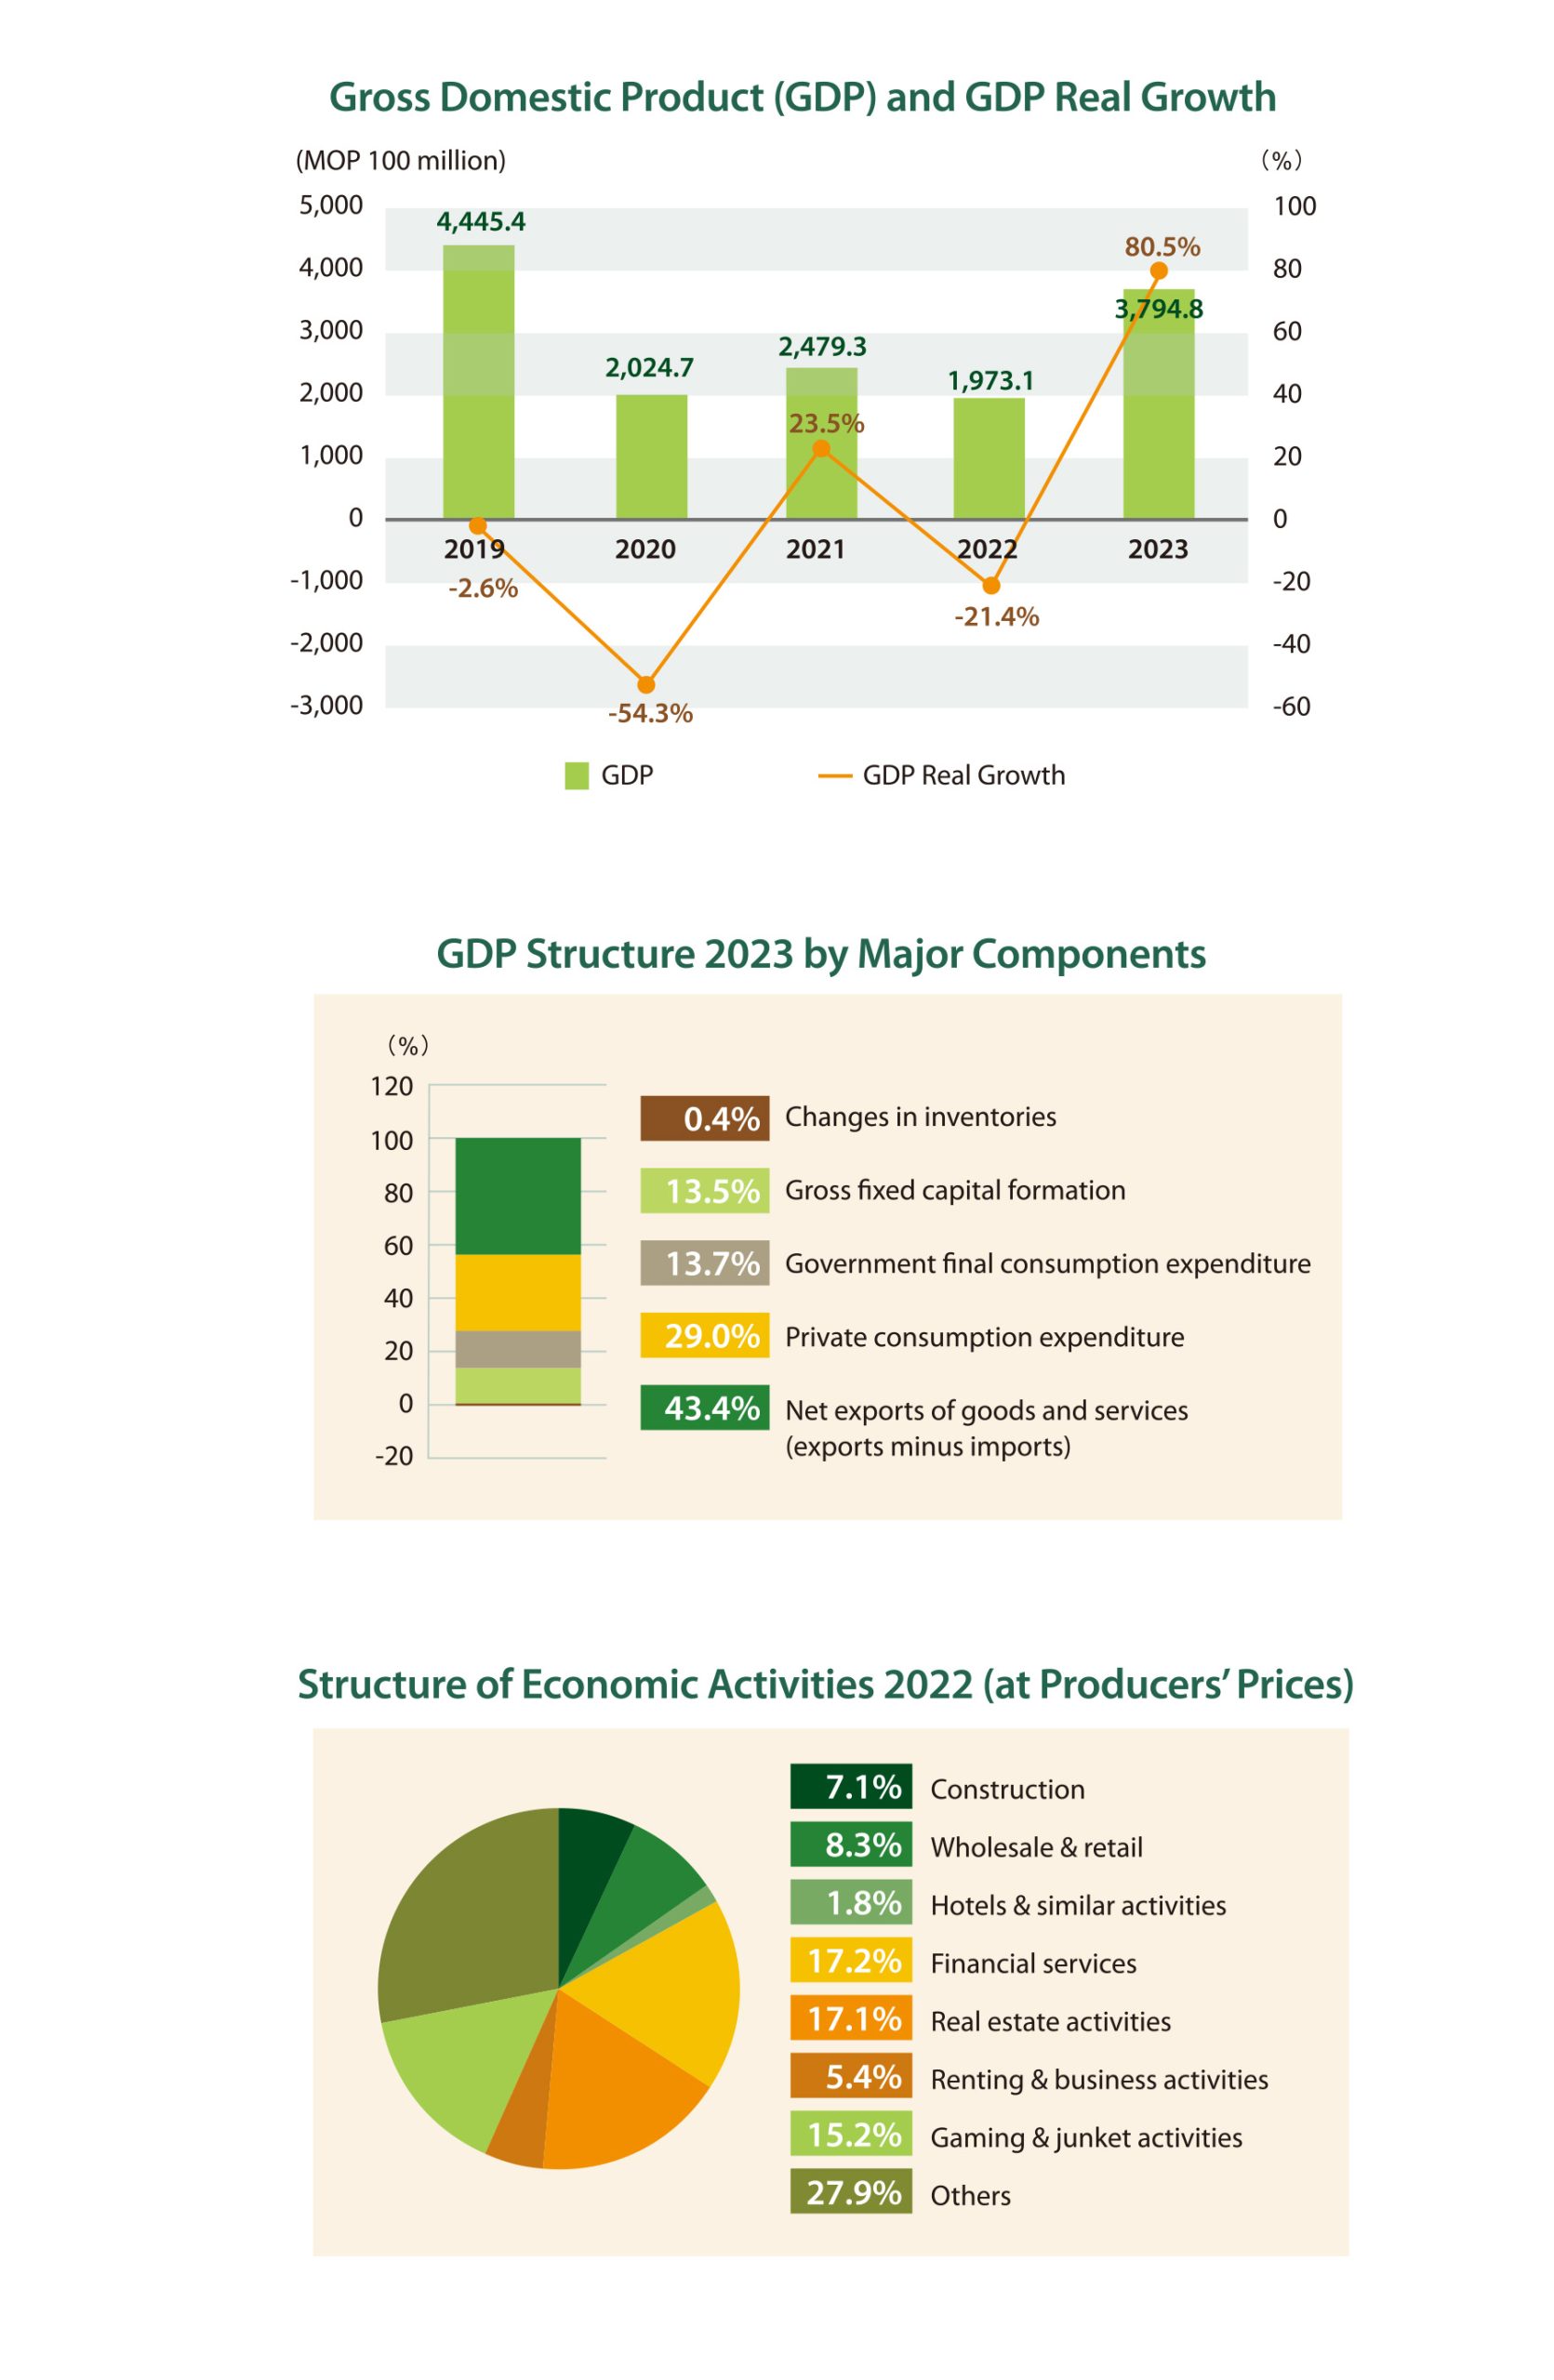
| Nominal GDP1 | 108 MOP | 3,795 (↑92.3%) |
980.1 | 1,077.1 | ↑ 9.9% | |
| 2023 | 2023 Q3 | 2023 Q4 | ||||
| Real GDP Growth Rate1 | % | 80.5% (+101.9%) |
120.4% | 86.4% | -34.0% | |
| 2023 | ||||||
| Per capita GDP1 | MOP | 559,495 (↑ 92.3%) |
– | – | – | |
| 2022 | ||||||
| Gross National Income,GNI1 | 108 MOP | 2,322.73 (↓ 6.0%) |
– | – | – | |
| Per capita GNI1 | MOP | 342,586 (↓ 5.3%) |
– | – | – | |
| 2023 | 2024 Feb | 2024 Mar | ||||
| Inflation rate1 | % | 0.94% (-0.1%) |
1.46% | 1.09% | -0.37% | |
| 2023 Dec | 2024 Jan | 2024 Feb | ||||
| Fiscal Reserves2 | 108 MOP | 5,814.1 (↑ 4%) |
5,855.3 | 5,923.7 | ↑ 1.2% | |
| 2023 Dec | 2024 Feb | 2024 Mar | ||||
| Foreign Exchange Reserves2 | 108 MOP | 2,235.6 (↑7.2%) |
2,293.7 | 2,262.1 | ↓ 1.4% | |
| Trade and Investment | ||||||
| 2023 | 2024 Feb | 2024 Mar | ||||
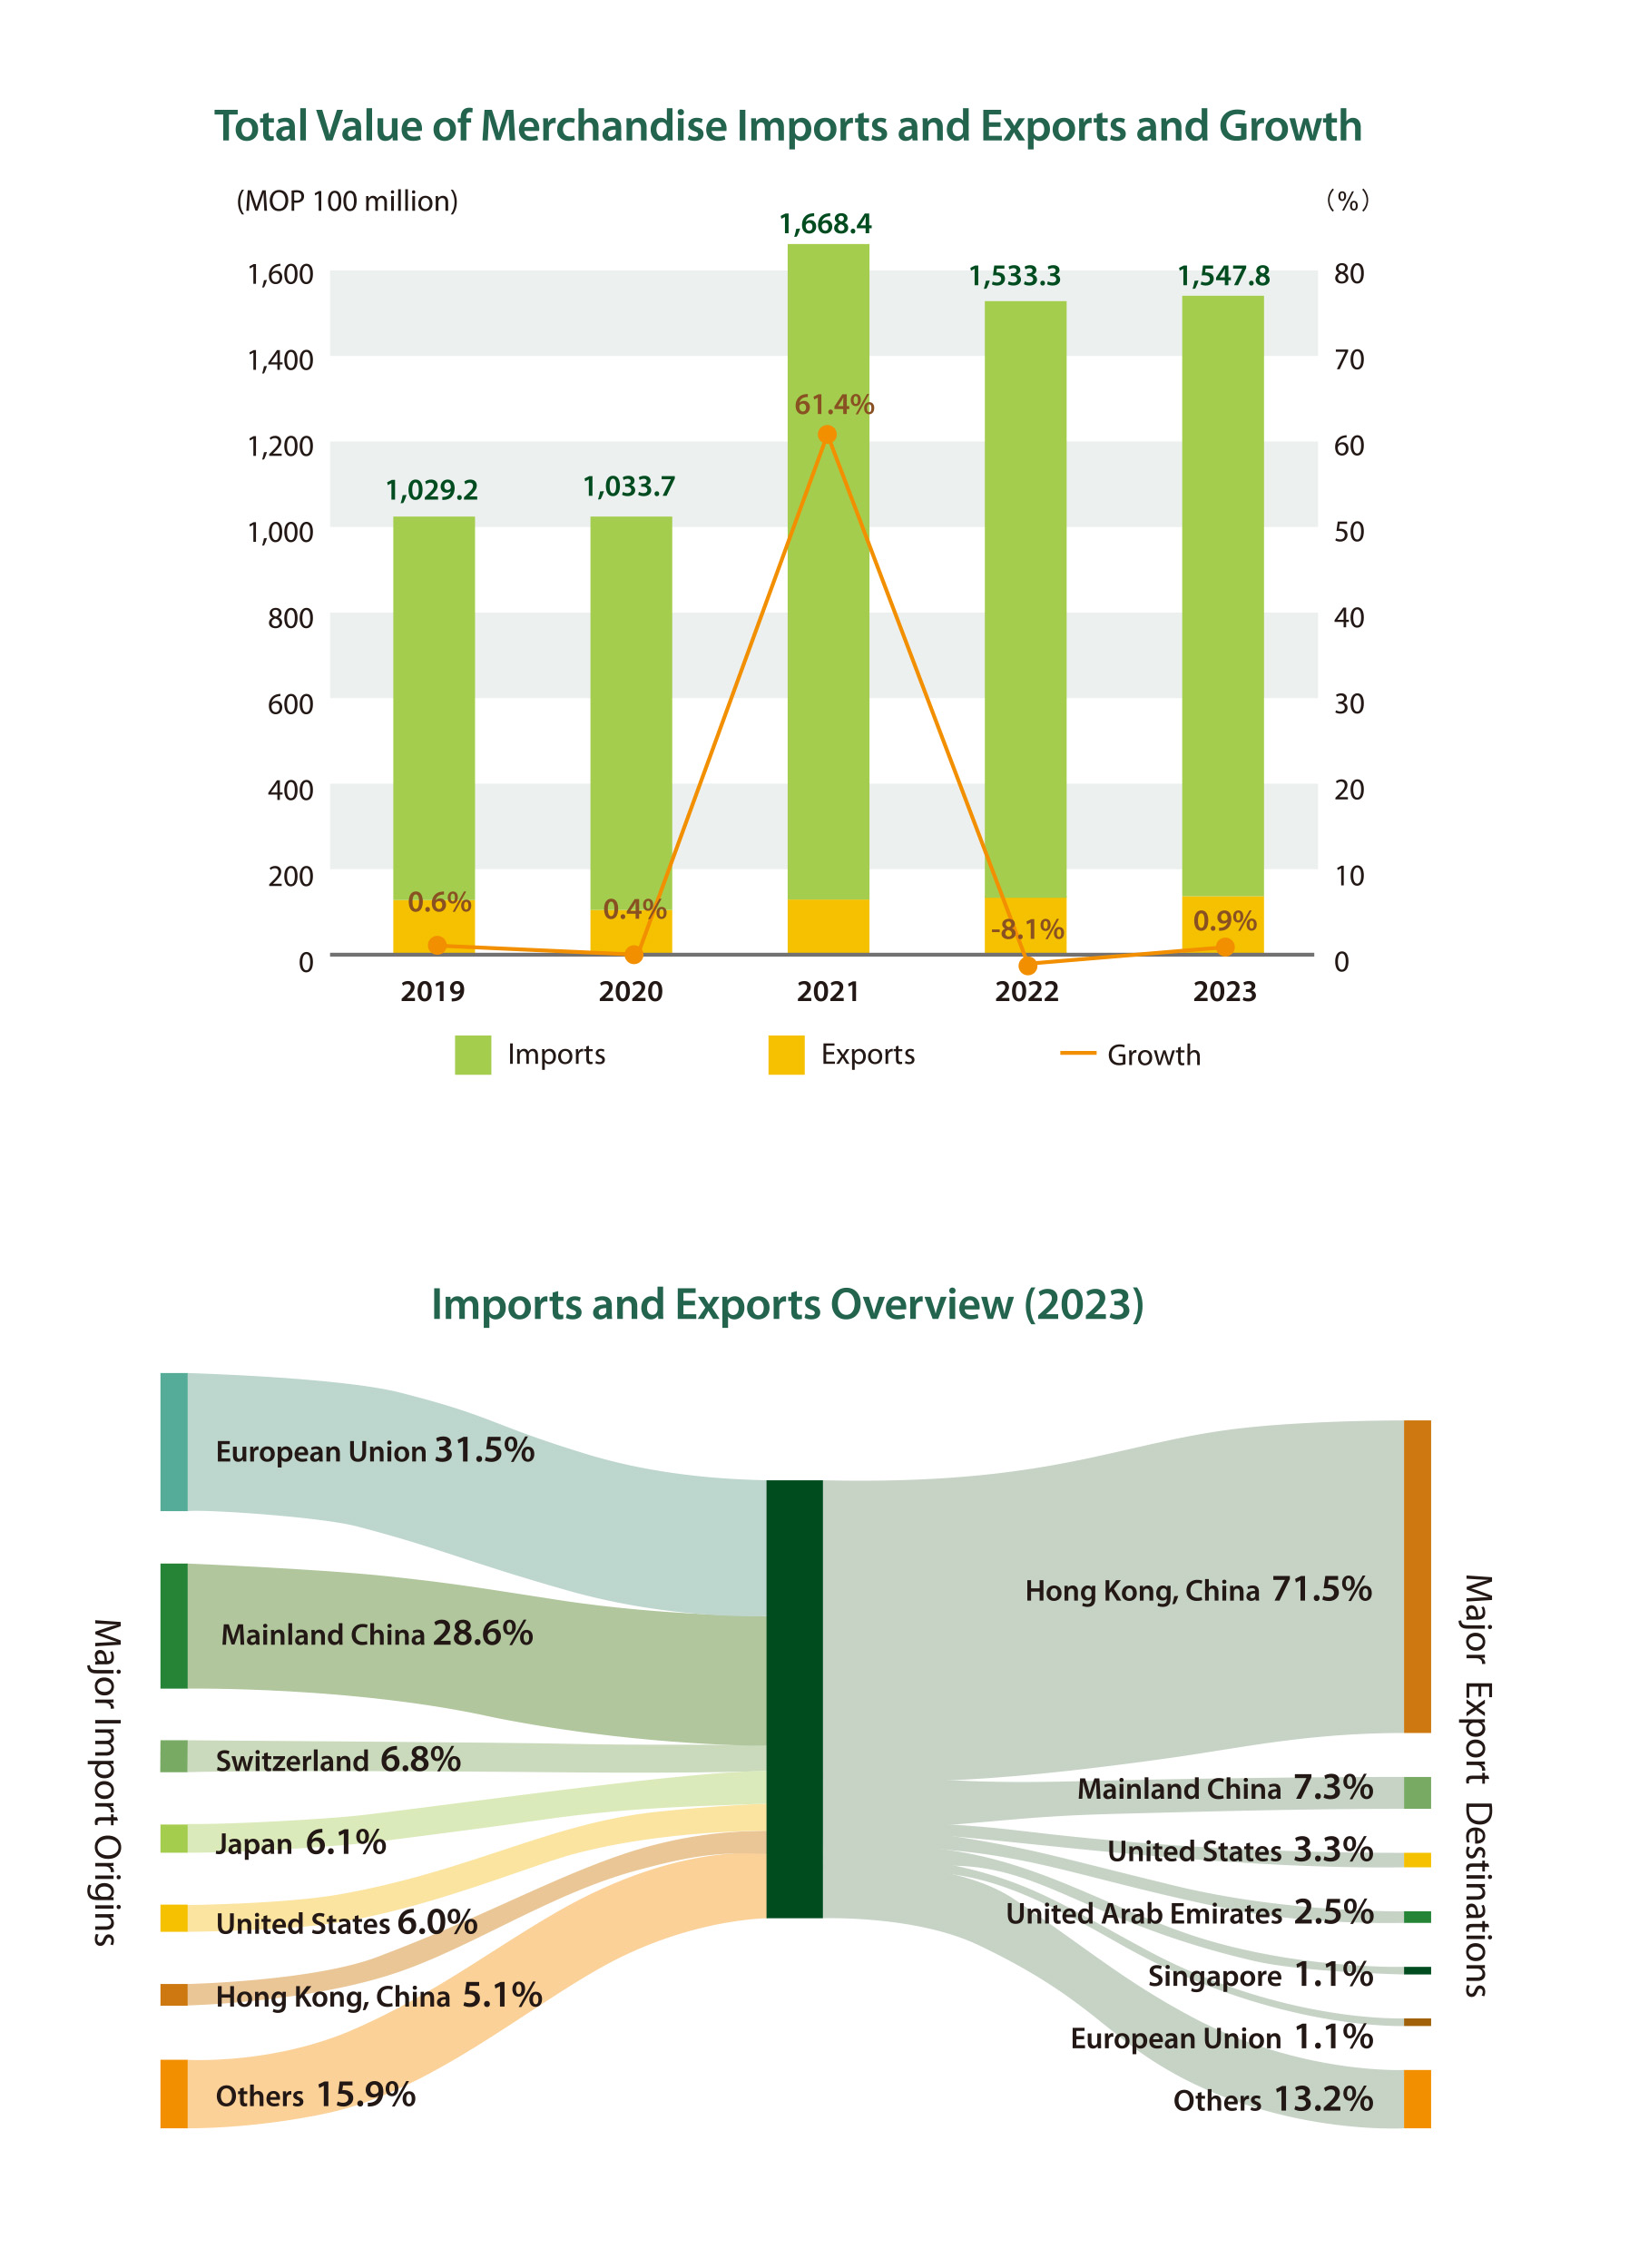
| Merchandise Trade1 | 108 MOP | 1,547.9 (↑ 0.9%) |
98.0 | 125.5 | ↑ 28.1% | |
| Import | 108 MOP | 1,414.4 (↑ 1.2%) |
88.3 | 113.4 | ↑ 28.5% | |
| Export | 108 MOP | 133.4 (↓ 1.3%) |
9.6 | 12.0 | ↑ 24.7% | |
| 2023 | 2023 Q3 | 2023 Q4 | ||||
| Trade in Services1 | 108 MOP | 3,476.0 (↑ 153.1%) |
903.8 | 977.8 | ↑ 8.2% | |
| Import | 108 MOP | 421.8 (↑ 36.5%) |
104.9 | 113.2 | ↑ 8% | |
| Export | 108 MOP | 3,054.2 (↑ 187%) |
798.9 | 864.6 | ↑ 8.2% | |
| 2022 | ||||||
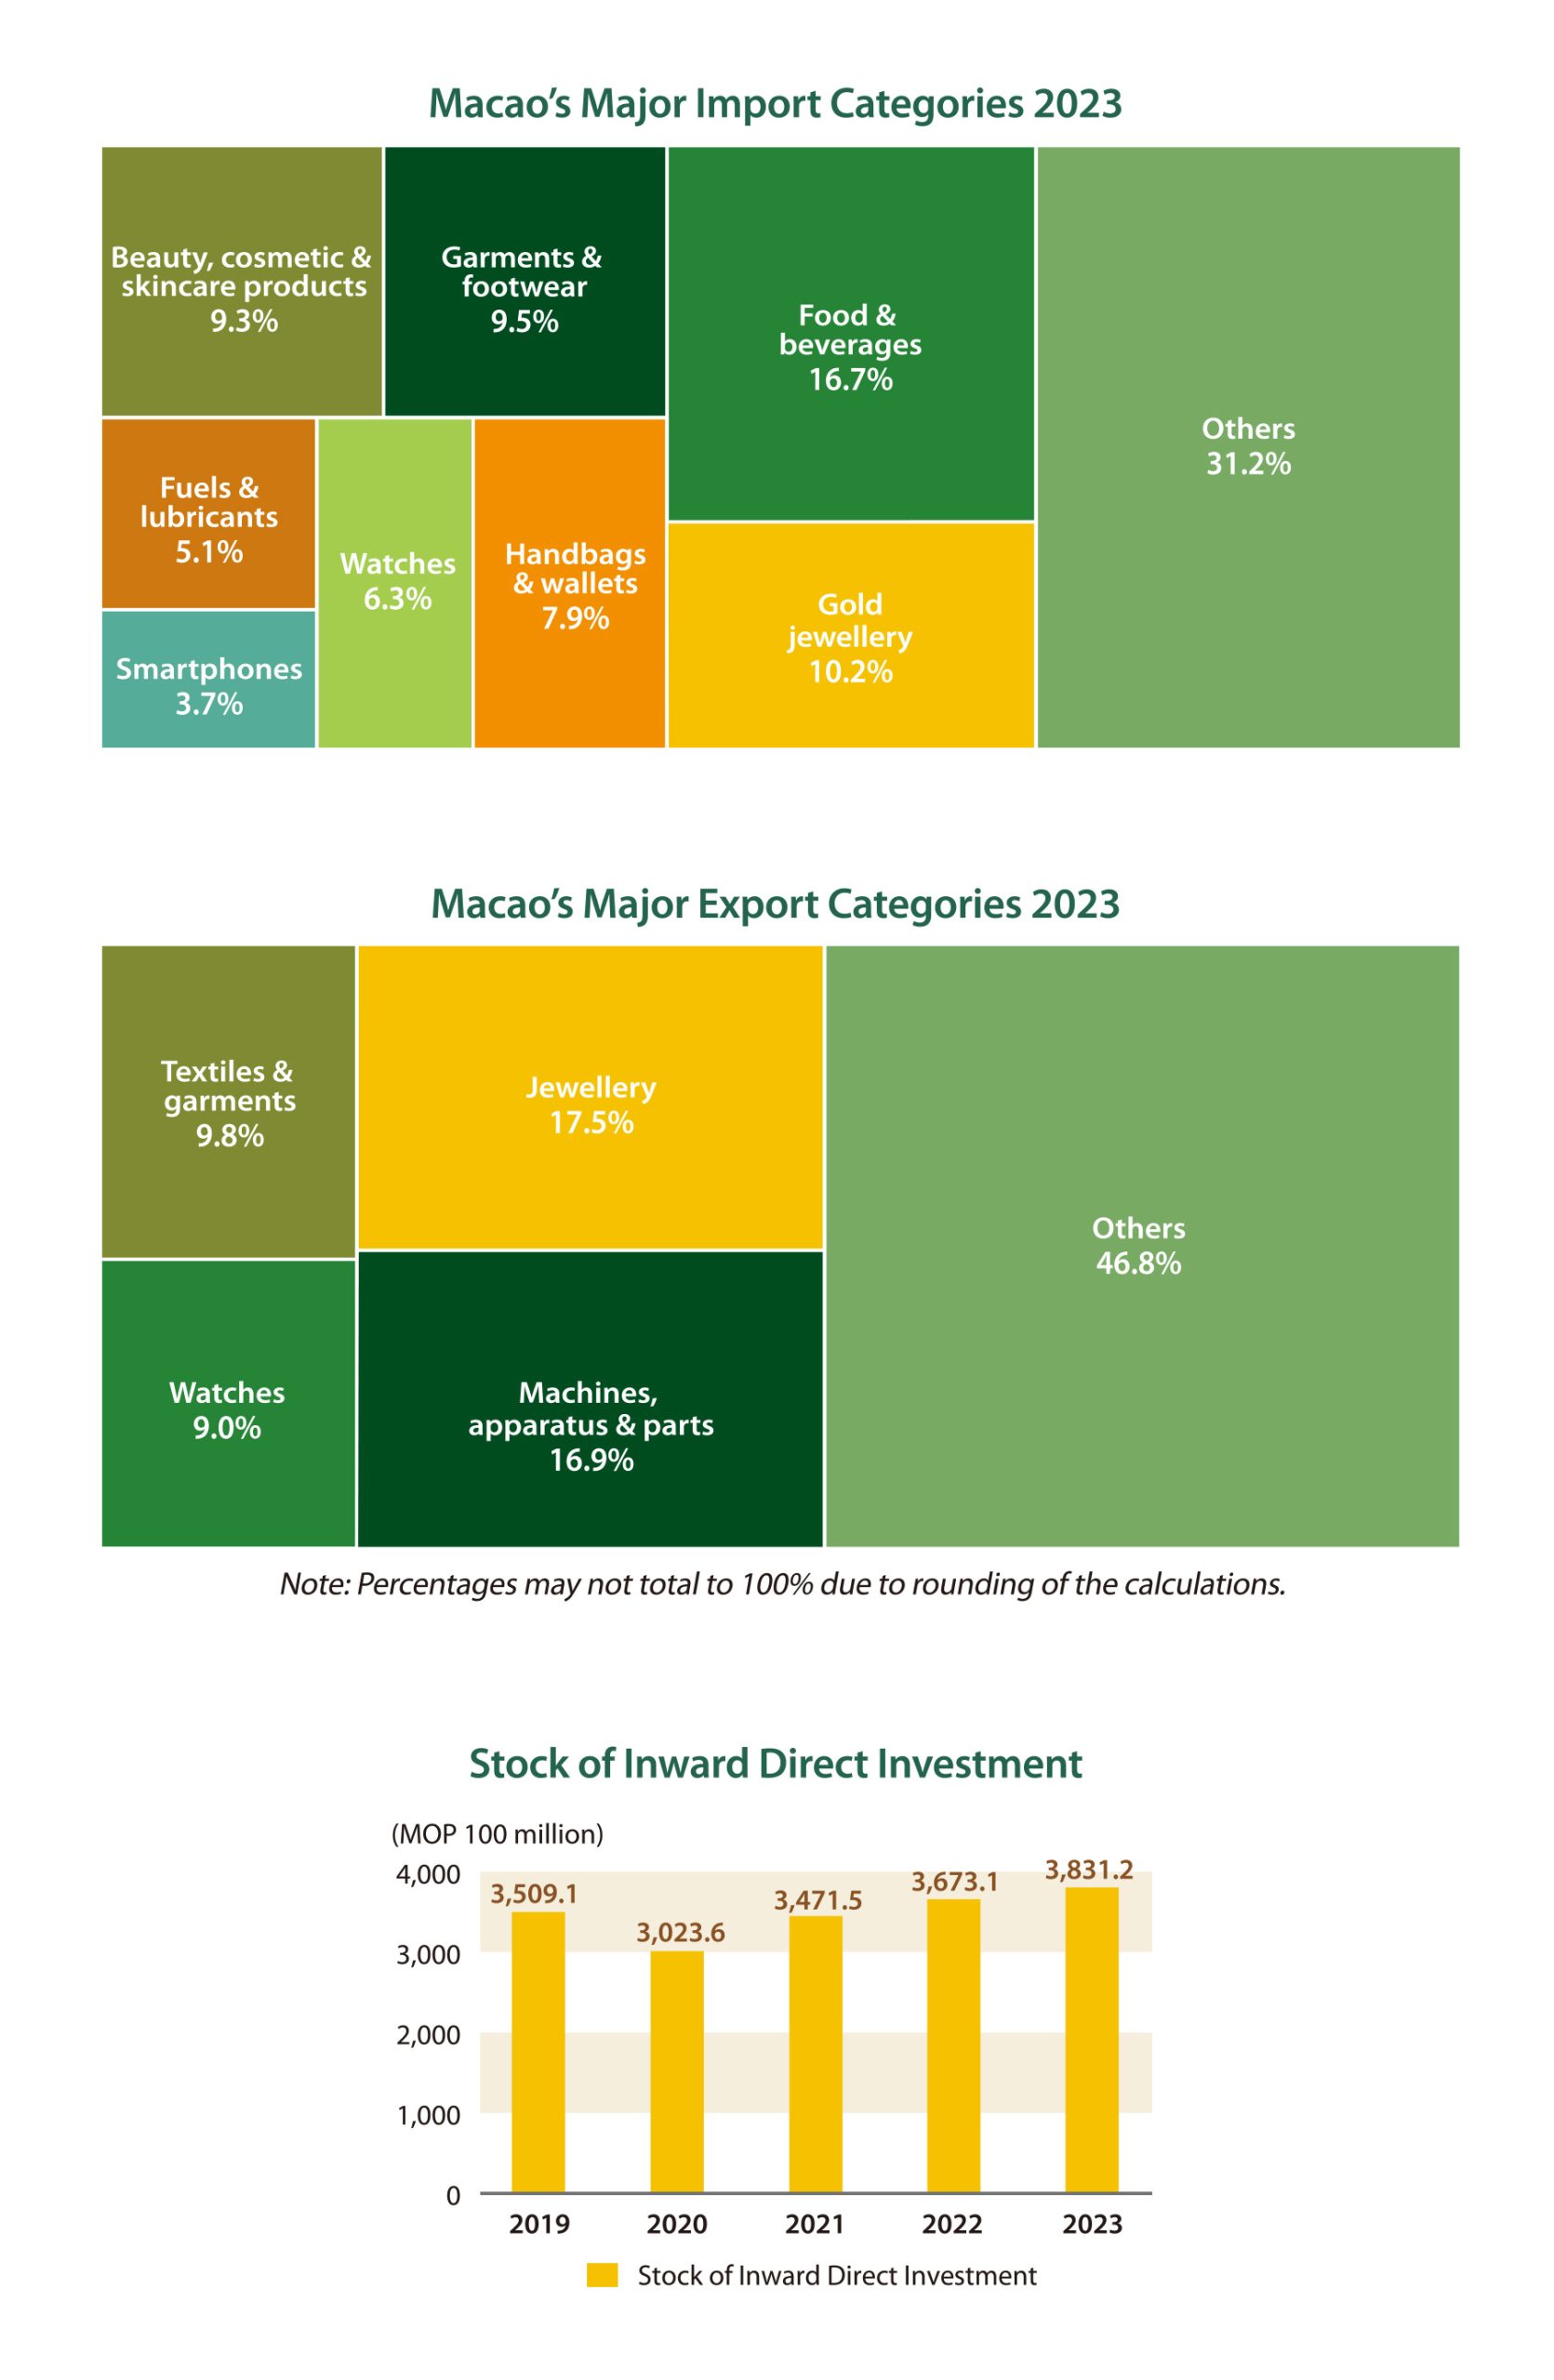
| Stock of Inward Direct Investment1 | 108 MOP | 3,673.1 (↑ 5.81%) |
– | – | – | |
| Stock of Outward Direct Investment1 | 108 MOP | 1,066.3 (↑ 6.02%) |
– | – | – | |
| Labour Market | ||||||
| 2023 | 2023 Q4 | 2024 Q1 | ||||
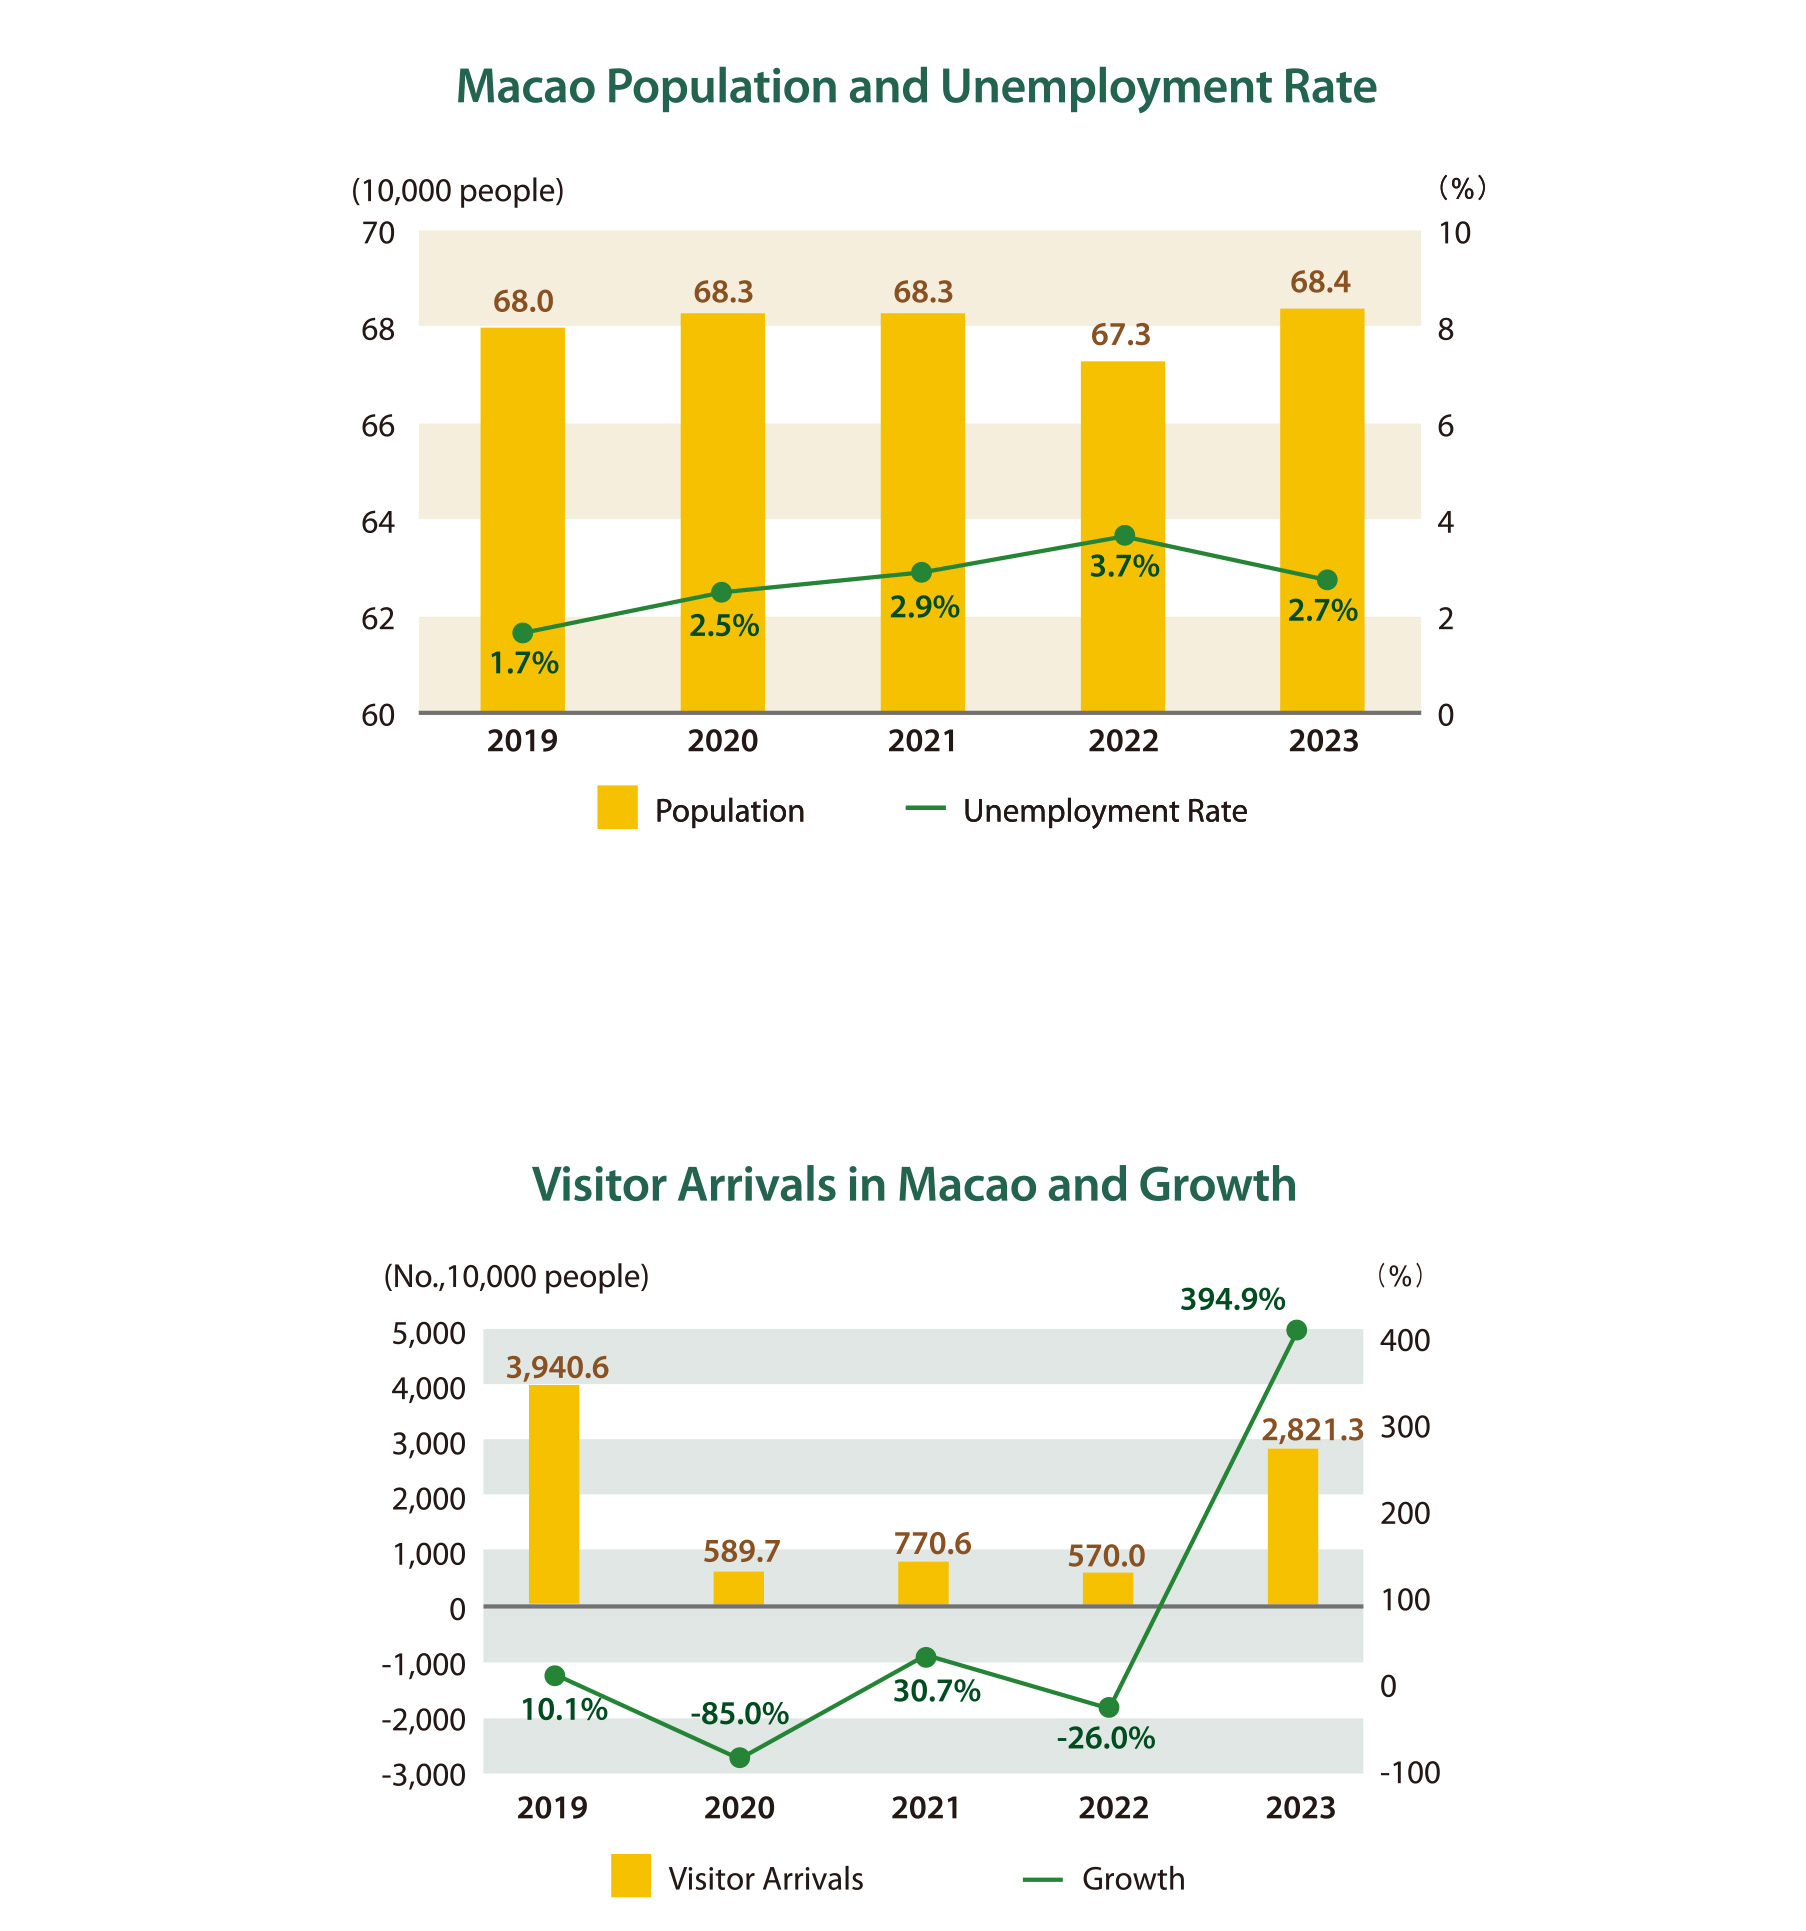
| Unemployment Rate1 | % | 2.7% (- 1.0%) |
2.3% | 2.1% | – 0.2% | |
| 2023 | 2023 Q4 | 2024 Q1 | ||||
| Median Monthly Employment Earnings1 | MOP | 17,500 (↑ 16.7%) |
17,600 | 18,000 | ↑ 2.3% | |
| Tourism Sector | ||||||
| 2023 | 2024 Feb | 2024 Mar | ||||
| Visitor Arrivals1 | man-time | 28,213,003 (↑ 394.9%) |
3,293,564 | 2,720,584 | ↓ 17.4% | |
| MICE Statistics | ||||||
| 2023 | 2023 Q3 | 2023 Q4 | ||||
| MICE Events1 | No. | 1,139 (↑138.8%) |
255 | 362 | ↑ 42% | |
| No. of Participants and Attendees1 | persons | 1,602,432 (↑ 12.7%) |
547,243 | 379,759 | ↓ 30.6% | |
| Newly Incorpoated Companies | ||||||
| 2023 | 2024 Feb | 2024 Mar | ||||
| New Incorporations1 | no. | 5,011 (↑ 21.9%) |
259 | 401 | ↑ 54.8% | |
| Socio-Demography | ||||||
| 2023 | ||||||
| Land Area3 | km2 | 33.3 (0%) |
– | – | – | |
| 2023 | 2023 Q3 | 2023 Q4 | ||||
| Population1 | 103 residents | 683.7 (↑ 1.6%) |
681.3 | 683.7 | ↑ 0.4% | |
資料來源:1:澳門特別行政區政府統計暨普查局
資料來源:2:澳門特別行政區政府金融管理局
資料來源:3:澳門特別行政區政府地籍局
註1:與前期比較變動率以↑/↓表示,前期與本期百分比差以 +/- 表示